How to Read Candlestick Patterns
Explore the basics of candlestick charts and learn how open, high, low, and close prices form useful visual patterns.

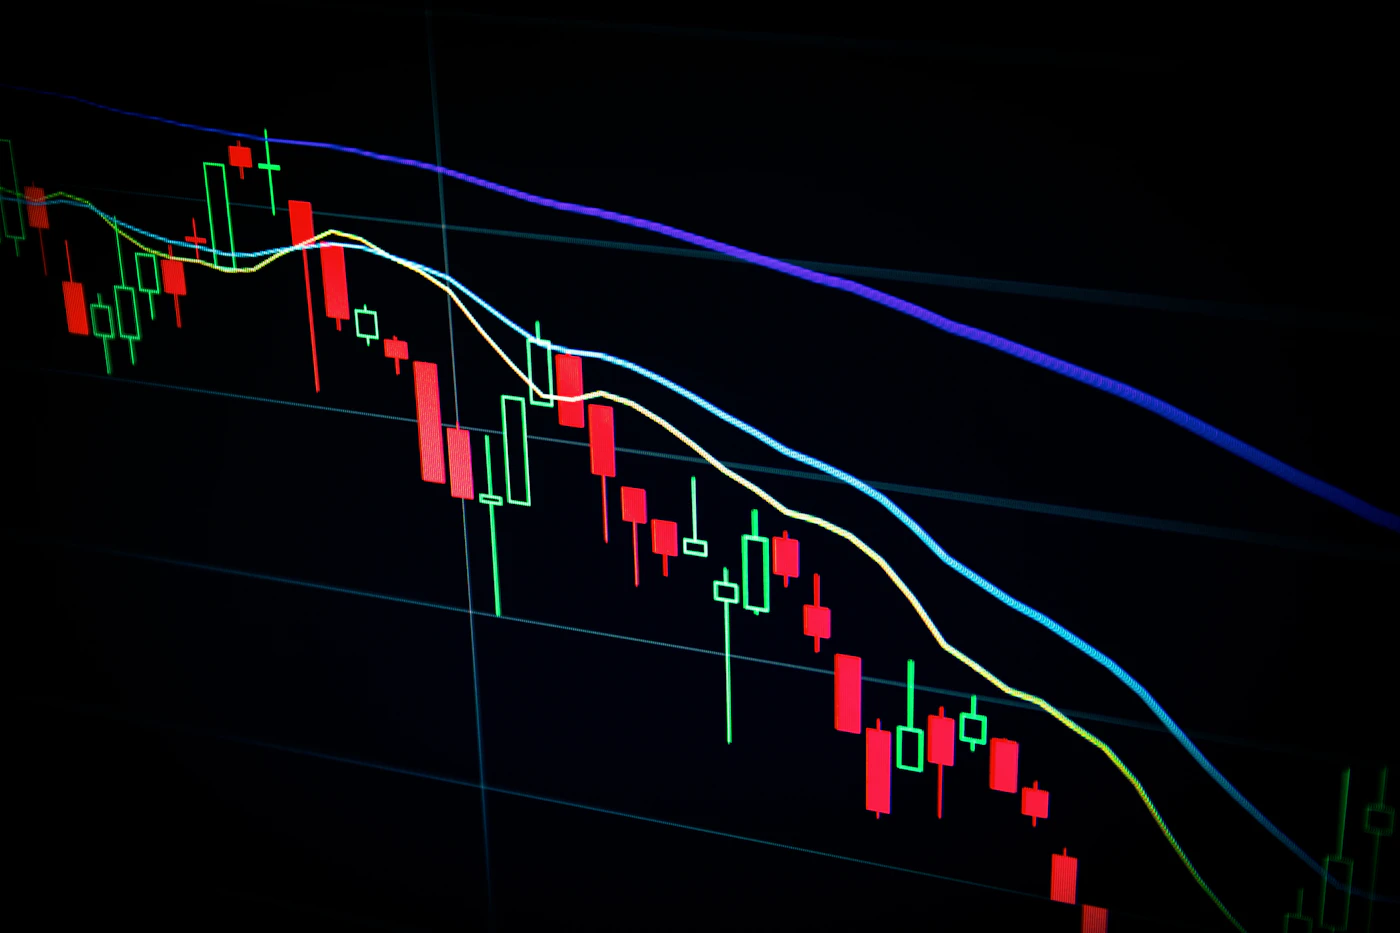
Candlestick charts provide a visual representation of price movement during a selected period.
Each candle generally contains four important pieces of information: open, high, low, and close. Together, these values show how price moved during the selected timeframe.
Patterns such as engulfing candles, pin bars, and inside bars are commonly studied by technical traders. However, a candle pattern should generally be considered within the broader market context.
The same candlestick can have different meanings depending on where it appears on a chart and what the surrounding price structure looks like.
Key Takeaways
- Learn the meaning of open, high, low, and close.
- Study candles in the context of market structure.
- Avoid treating individual patterns as guaranteed signals.
- Combine candle analysis with a defined trading plan.
Educational Disclaimer: This article is provided for educational and informational purposes only. It does not constitute financial, investment, legal, or tax advice. Financial markets involve risk, and past performance does not guarantee future results.